Code
source("../dsan-globals/_globals.r")
source("../dsan-globals/_globals-sf.r")PPOL 6805 / DSAN 6750: GIS for Spatial Data Science
Fall 2026
source("../dsan-globals/_globals.r")
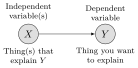
source("../dsan-globals/_globals-sf.r")Social Science (McCourt):
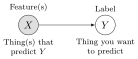
Machine Learning (DSAN):
mapview \(\leadsto\) Leaflet!library(leaflet) |> suppressPackageStartupMessages()
library(leaflet.extras2) |> suppressPackageStartupMessages()
library(mapview) |> suppressPackageStartupMessages()
set.seed(6805)
city_df <- tibble::tribble(
~city, ~lon, ~lat, ~pop,
"Chicago", 41.950567516553896, -87.93011127491978, 2746388,
"Detroit", 42.45123004999075, -83.18402319217698, 631524
)
city_sf <- sf::st_as_sf(
city_df,
coords = c("lat", "lon"),
# Reminder: CRS 4326 is more *efficient* for web
# display (uses less memory on average);
# CRS 3857 is less efficient (uses more memory
# on average), since it includes info necessary
# for precise *distance* calculations (hence
# spatstat's 3857 requirement for ppp objects)
crs=4326
)
city_buf_sf <- city_sf |> sf::st_buffer(20000)
city_cases_sf <- city_buf_sf |>
sf::st_sample(size=rep(10,2)) |>
sf::st_as_sf()
city_cases_sf$city <- "Detroit (10 Cases)"
city_cases_sf[1:10, 'city'] <- "Chicago (10 Cases)"
city_cases_sf$sample <- "Flu"
# Now sample from *population* to visualize
# *base rates*
city_pop_sf <- city_buf_sf |>
sf::st_sample(size=c(16, 4)) |>
sf::st_as_sf()
city_pop_sf$city <- "Detroit"
city_pop_sf[1:16, 'city'] <- "Chicago"
city_pop_sf$sample <- "People"
# Uncomment for "plain" mapview output (compare!)
# city_combined_sf <- bind_rows(
# city_cases_sf,
# city_pop_sf
# )
# mapview(
# city_combined_sf, zcol="city", marker="sample"
# )
# Custom icon from *local* image for flu cases
Flu = makeIcon(
iconUrl="images/Maki2-danger-24.svg",
iconRetinaUrl="images/Maki2-danger-24.svg",
iconWidth=20,
iconHeight=20,
className='highlight-icon'
)
# Custom icon from *web* image for base rates
People = makeIcon(
iconUrl="https://upload.wikimedia.org/wikipedia/commons/e/ef/Maki2-pitch-24.svg",
iconRetinaUrl="https://upload.wikimedia.org/wikipedia/commons/e/ef/Maki2-pitch-24.svg",
iconWidth=20,
iconHeight=20
)
leaflet(city_cases_sf) |>
addProviderTiles("Esri.WorldGrayCanvas") |>
# addProviderTiles("CartoDB.Positron") |>
addMarkers(data=city_cases_sf, icon = Flu) |>
addMarkers(data=city_pop_sf, icon = People) |>
addControl(
html_legend(
urls = c("https://raw.githubusercontent.com/jpowerj/dsan-content/refs/heads/main/2026-fall-ppol6805/Maki2-danger-24.svg", "https://upload.wikimedia.org/wikipedia/commons/e/ef/Maki2-pitch-24.svg"),
labels = c("Flu", "At Risk"),
title = "Status"
),
position = "bottomright"
) |>
addControl(
html_label("Chicago<br>Population 2.7 million"),
position = "topleft"
) |>
addControl(
html_label("Detroit, MI<br>Population 650,000"),
position = "topright"
)library(tidyverse) |> suppressPackageStartupMessages()
library(sf) |> suppressPackageStartupMessages()
library(osmdata) |> suppressPackageStartupMessages()
library(mapview) |> suppressPackageStartupMessages()
get_osm_cached <- function(query, cache_file, tries = 3) {
if (file.exists(cache_file)) {
message("Loading cached data from ", cache_file)
return(readRDS(cache_file))
}
for (i in seq_len(tries)) {
result <- tryCatch(
osmdata_sf(query),
error = function(e) {
message("Attempt ", i, " failed: ", conditionMessage(e))
NULL
}
)
if (!is.null(result)) {
saveRDS(result, cache_file)
message("Saved to ", cache_file)
return(result)
}
Sys.sleep(5)
}
stop("Failed to fetch after ", tries, " attempts.")
}
nh_bbox <- getbb("New Haven, CT")
highway_result <- opq(bbox=nh_bbox) |>
add_osm_feature(
key = "highway",
value = "motorway"
)
transport_result <- opq(bbox=nh_bbox) |>
add_osm_feature(
key="public_transport"
)
nh_road_sfs <- get_osm_cached(highway_result, "data/nh_road_sfs.rds")Loading cached data from data/nh_road_sfs.rdsnh_transport_sfs <- get_osm_cached(transport_result, "data/nh_transport_sfs.rds")Loading cached data from data/nh_transport_sfs.rdsnh_road_sf <- nh_road_sfs$osm_linesmapview(nh_road_sf)leaflet() |>
leaflet::addProviderTiles("Esri.WorldGrayCanvas") |>
leaflet::addPolylines(
data=nh_road_sf, weight=2
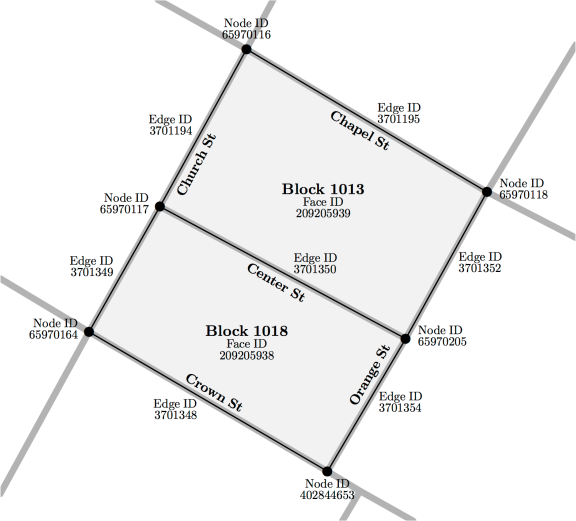
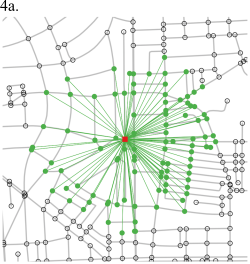
)Step : Mapping Inequality

Step Quantifying and evaluating hypotheses about urban segregation
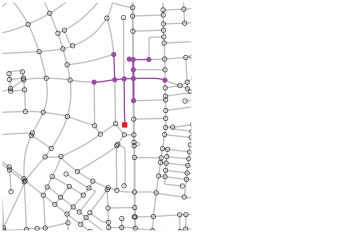

custom_upper_left <- c(41.362432360113566, -72.9722636671877)
custom_lower_right <- c(41.34295668062255, -72.9385289699316)
bbox_coords <- c(
  custom_upper_left[2],
  custom_upper_left[1],
  custom_lower_right[2],
  custom_lower_right[1]
)
names(bbox_coords) = c("xmin","ymin","xmax","ymax")
custom_sf <- st_as_sf(
  st_as_sfc(
    st_bbox(bbox_coords)
  ),
  crs=4326
)
# nh_query <- opq(bbox=bbox_coords) |>
#   add_osm_feature(
#     key = "highway"
#   )
# nh_sfs <- osmdata_sf(nh_query)
# nh_road_sf <- nh_sfs$osm_lines
# mapview(nh_road_sf)
mapview(custom_sf)