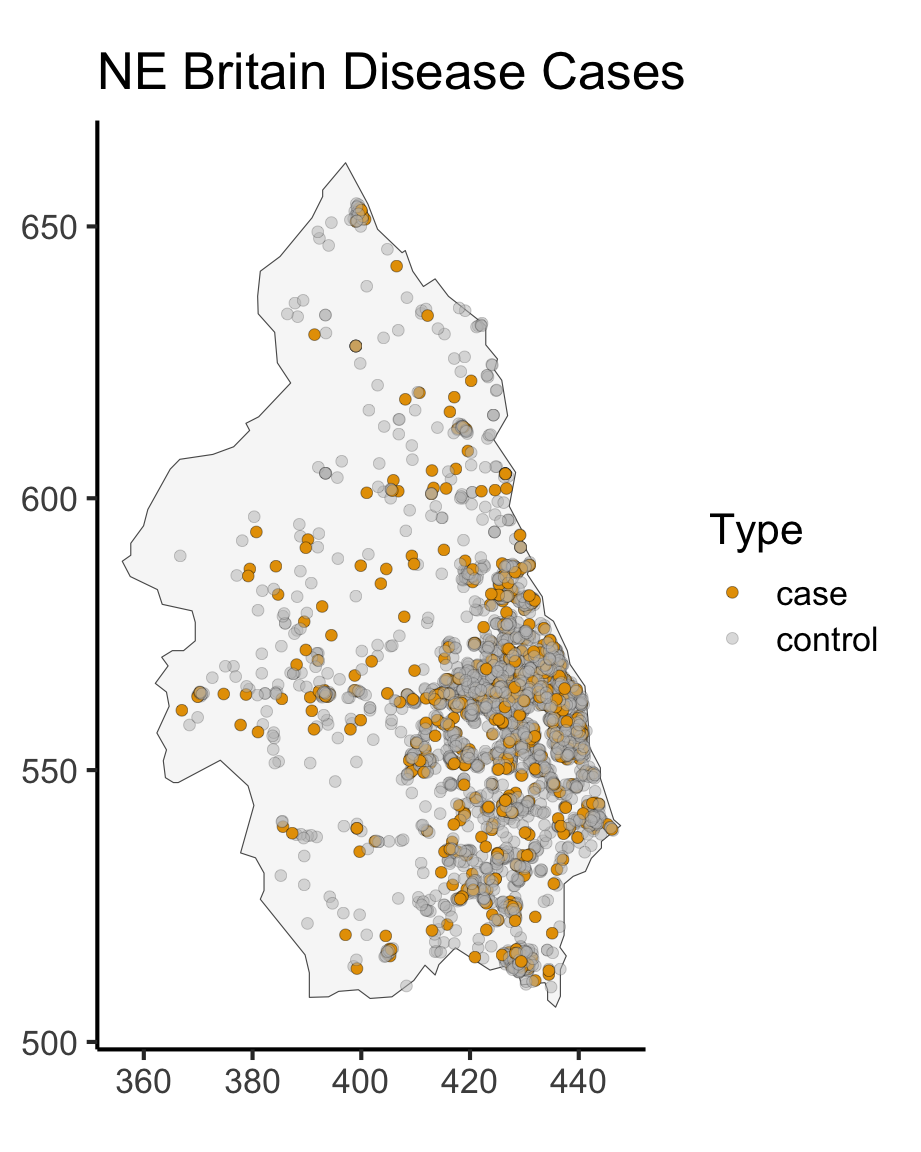
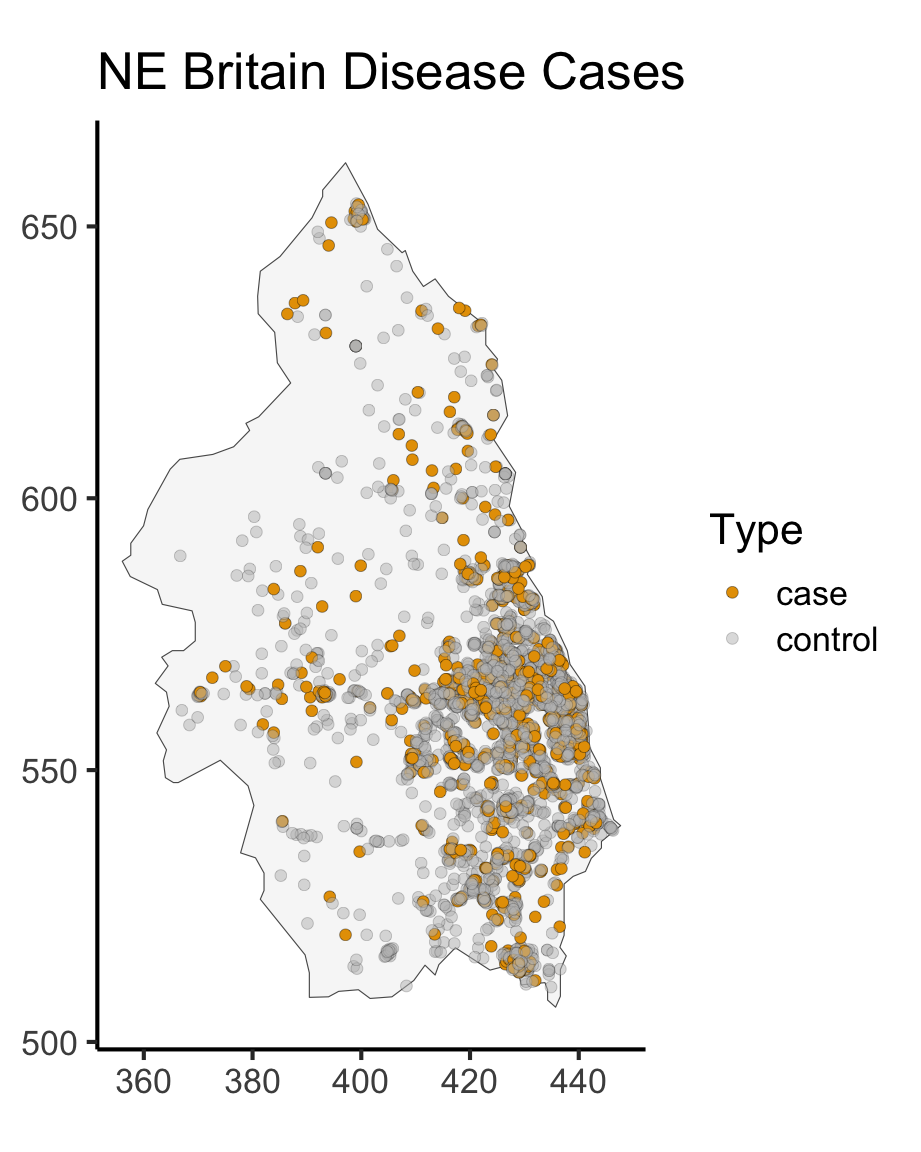
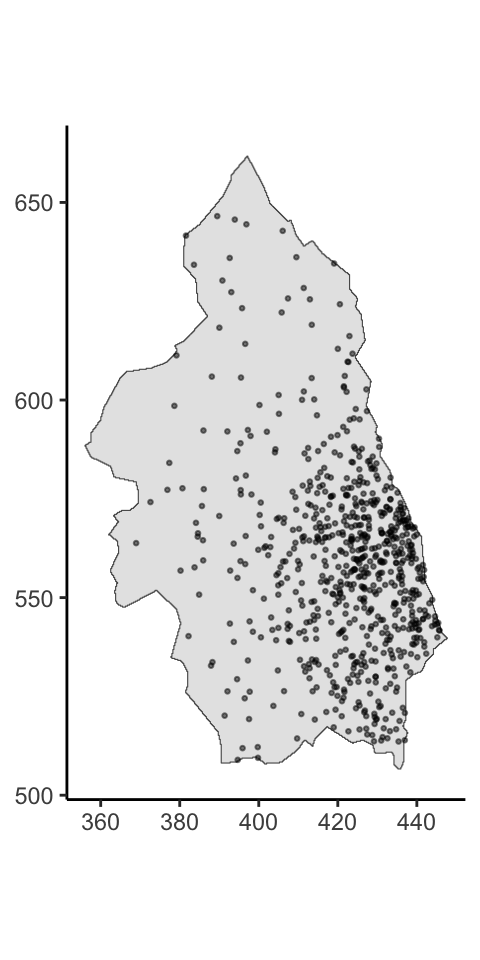
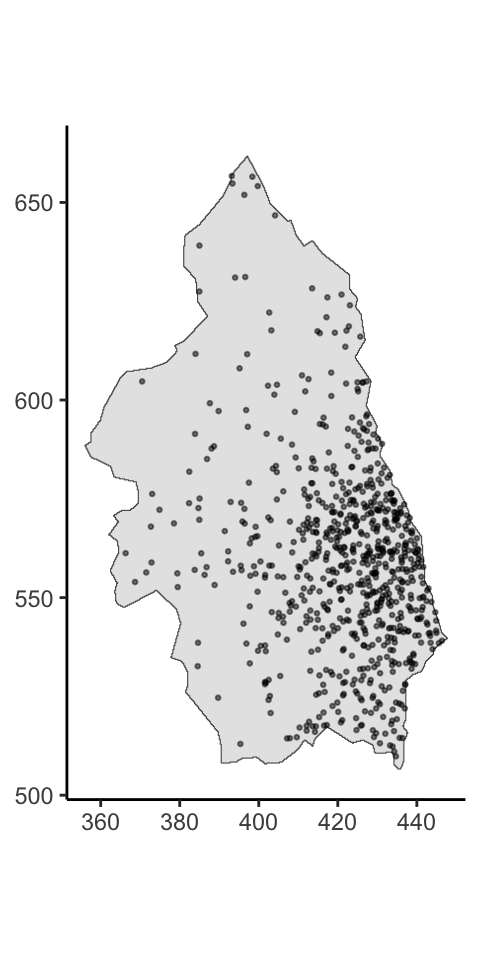
Week 10: Evaluating Spatial Hypotheses II: Areal Data

PPOL 6805 / DSAN 6750: GIS for Spatial Data Science
Fall 2024

Class Sessions
Author
Affiliation

Jeff Jacobs

Published

Wednesday, October 30, 2024

Open slides in new tab →

Roadmap to the Midterm!

  • Last Week (Oct 23): Evaluating Hypotheses for Point Data
  • Today (Oct 30): Evaluating Hypotheses for Areal Data
  • In-Class Midterm (Nov 6): Basically a “mini-homework” on Spatial Data Science unit (topics from HW4 onwards)!

Point Processes \(\rightarrow\) Areal Processes

  • The “Complete” Part of Complete Spatial Randomness (CSR)
  • Bringing Neighbors Back In
  • Spatial Regression

Points \(\rightarrow\) Areas

Aggregating Point Processes

  • Recall the two “stages” of our Poisson-based point processes
    • A Poisson-distributed number of points, then
    • Uniformly-distributed coordinates for each point
  • One way to see areal data modeling: we keep the Poisson part, but we no longer observe the coordinates for the points!
  • So… why is it still helpful for you to have sat through those lectures on Point Processes? Two reasons…

(1) Areal Patterns = Aggregated Point Patterns

  • One application, mentioned last week: areal-weighted interpolation using actual models of how the points are distributed within the area!
    • Regularly-spaced points is rarely a good “default” model!
    • Humans, for example, rarely live at perfect evenly-spaced intervals… they form households, villages, cities
    • Regularly-spaced points (we now know) \(\implies\) negative autocorrelation \(\implies\) typically due to inhibition process (competition)

(2) Spatial Scan Statistics

  • Areal regions often the result of artificial / “arbitrary” human divisions
    • (Particulate matter doesn’t pass through customs)
  • \(\implies\) If we care about processes which don’t “adhere to” borders (like disease spread), we want to “scan” buffers around points regardless of areal borders

(3) Hierarchical Bayesian Smoothing

  • The issue might just be not enough data for some areas, while we have an abundance of data in nearby areas…

From Kramer (2023), Spatial Epidemiology

Autocorrelation on Networks

Reminder: Weight Matrix Defines “Neighbors”

Choices Available in spdep

  • \(w_{ij} = 1\) if \(i\) and \(j\) “overlap”
    • Rook: Overlap is 1 or 2-dimensional
    • Queen: Overlap is 0, 1, or 2-dimensional
  • \(w_{ij} = \frac{1}{\text{dist}(i, j)}\)
  • \(w_{ij} = 1\) if \(dist(i, j) < \overline{D}\)
  • \(w_{ij} = 1\) for \(K\) nearest neighbors

Moran’s \(I\) One More Time

  • Round 1 (Week 6): Moran’s \(I\) as “thermometer”
  • Round 2 (Today): Could an \(I\) value this extreme occur due to random noise?

Example: Bolshevik Revolution \(\rightarrow\) “Bipolar” World

  • Null hypothesis: no spatial effect of democratization/de-democratization on neighboring countries
  • If null hypothesis is true, and countries democratize/de-democratize independently… could this pattern still arise?

Spatial Regression

  • (We made it! This is the last Spatial Data Science topic!)
  • (Nearly all extremely-fancy applied GIS models can be implemented via Spatial Regression!)

Motivation: When Does Non-Spatial Regression “Work”?

\[ Y_i = \beta_0 + \beta_1X_{i,1} + \beta_2X_{i,2} + \cdots + \beta_MX_{i,M} + \varepsilon_i \]

  • Importance of OLS regression: can give us the Best Linear Unbiased Estimator (BLUE)

  • This is only true if the Gauss-Markov assumptions hold—one of these is that the error terms are uncorrelated:

    \[ \text{Cov}[\varepsilon_i, \varepsilon_j] = 0 \; \forall i \neq j \]

Spatial Autocorrelation in Residuals

  • We have now seen several models / datasets where effect of some variable \(X\) (say, population) on another variable \(Y\) (say, disease count) is spatial! (Kind of the whole point of the class 😜)
  • So, to see when OLS will “work”, vs. when you need to incorporate GIS, key step is plotting the spatial distribution of regression residuals!

Example: Italian Elections

Ward and Gleditsch (2018), Figure 2.3

Ward and Gleditsch (2018), Figure 2.4

Will OLS “Work” Here?

  • Can we use OLS to derive the BLUE of the effect of GDP on voting?
Plain OLS
\(N = 477\) \(\widehat{\beta}\) SE \(t\)
Intercept 35.30 2.21 15.96
Log GDP per cap 13.46 0.65 20.84

Moran’s \(I\) for residuals = 0.47(!)


Spatial Regression
\(N = 477\) \(\widehat{\beta}\) SE \(t\)
Intercept 4.70 1.66 2.80
Log GDP per cap 1.77 0.48 3.66
\(\rho\) 0.87 0.02 36.7

What Does it Mean that “Spatial Effect” is Significant?

Ward and Gleditsch (2018), Figure 2.5

Case 1: No Residual Spatial Autocorrelation

  • Example: Residuals have Moran’s \(I\) near 0…
  • …Don’t need GIS at all!

Case 2: Conditional Autoregressive Model (CAR)

  • GIS, but… only for “fixing” your regression

\[ Y_i = \underbrace{\mu_i}_{\text{Non-spatial model}} + \underbrace{\frac{1}{w_{i,cdot}}\sum_{j \neq i}(Y_j - \mu_j)}_{\text{Spatial Autocorrelation}} + \varepsilon_i \]

Case 3: Simultaneous Autoregressive Model (SAR)

  • The main event! Here we are explicitly modeling “spatially lagged” versions of our dependent variable \(Y\)!

\[ Y = \mathbf{X}\beta + \rho \underbrace{\mathbf{W}Y}_{\mathclap{\text{Spatially-lagged }Y}} + \boldsymbol\varepsilon \]

References

Ward, Michael D., and Kristian Skrede Gleditsch. 2018. Spatial Regression Models. SAGE Publications.