import pandas as pd
import numpy as np
rng = np.random.default_rng(seed=5650)
import matplotlib.pyplot as plt
import seaborn as sns
cb_palette = ['#e69f00','#56b4e9','#009e73']
sns.set_palette(cb_palette)
from scipy.special import expit
# The original R code:
# sim_happiness <- function( seed=1977 , N_years=1000 , max_age=65 , N_births=20 , aom=18 ) {
# set.seed(seed)
# H <- M <- A <- c()
# for ( t in 1:N_years ) {
# A <- A + 1 # age existing individuals
# A <- c( A , rep(1,N_births) ) # newborns
# H <- c( H , seq(from=-2,to=2,length.out=N_births) ) # sim happiness trait - never changes
# M <- c( M , rep(0,N_births) ) # not yet married
# # for each person over 17, chance get married
# for ( i in 1:length(A) ) {
# if ( A[i] >= aom & M[i]==0 ) {
# M[i] <- rbern(1,inv_logit(H[i]-4))
# }
# }
# # mortality
# deaths <- which( A > max_age )
# if ( length(deaths)>0 ) {
# A <- A[ -deaths ]
# H <- H[ -deaths ]
# M <- M[ -deaths ]
# }
# }
# d <- data.frame(age=A,married=M,happiness=H)
# return(d)
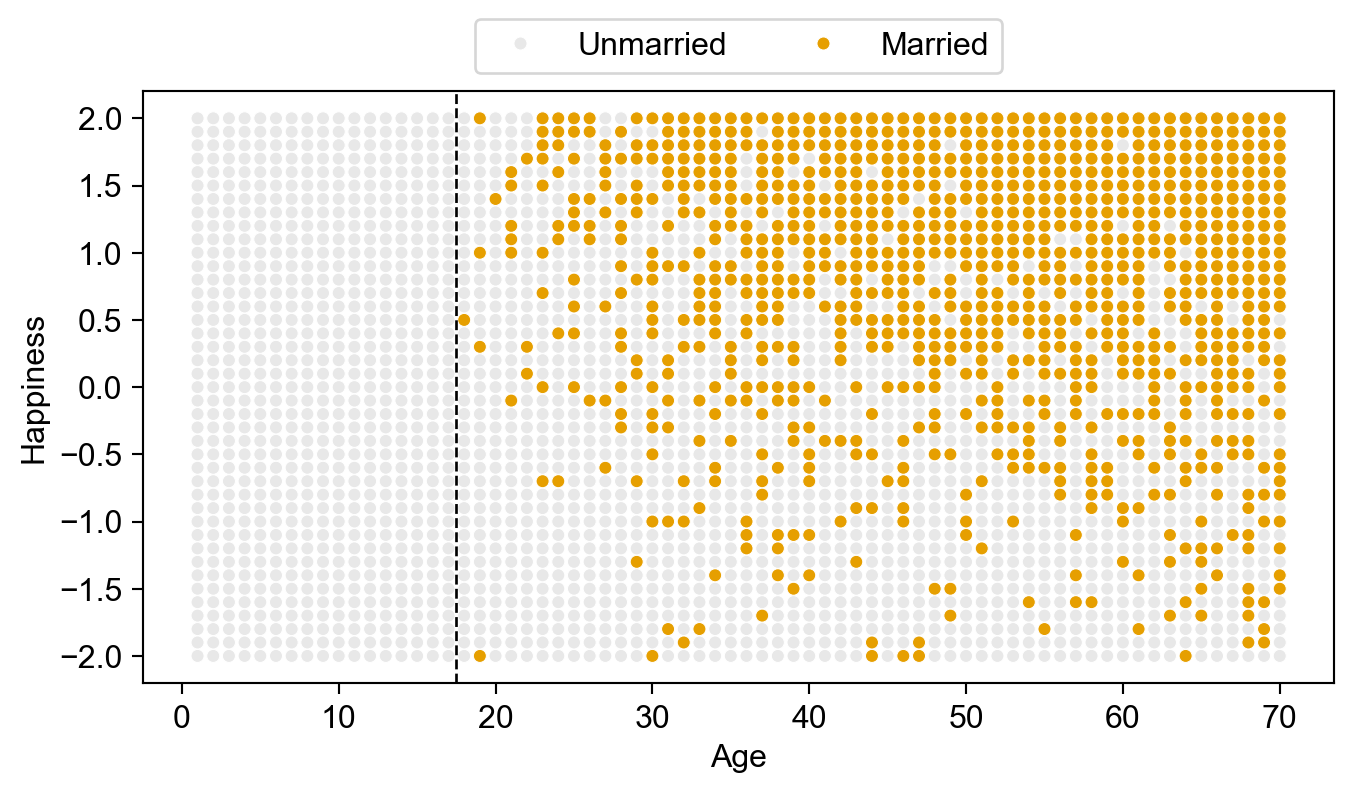
# DGP: happiness -> marriage <- age
years = 70
num_births = 41
colnames = ['age','a','h','m']
sim_dfs = []
A = np.zeros(shape=(num_births,1))
H = np.linspace(-2, 2, num=num_births)
M = np.zeros(shape=(num_births,1))
def update_m(row):
if row['m'] == 0:
return int(rng.binomial(
n=1,
p=expit(row['h'] - 3.875),
size=1,
)[0])
return 1
def sim_cohort_to(max_age):
sim_df = pd.DataFrame({
'age': [1 for _ in range(num_births)],
'h': np.linspace(-2, 2, num=num_births),
'm': [0 for _ in range(num_births)],
}
)
for t in range(2, max_age + 1):
sim_df['age'] = sim_df['age'] + 1
if t >= 18:
sim_df['m'] = sim_df.apply(update_m, axis=1)
return sim_df
all_sim_dfs = []
for cur_max_age in range(1, 71):
cur_sim_df = sim_cohort_to(cur_max_age)
all_sim_dfs.append(cur_sim_df)
full_sim_df = pd.concat(all_sim_dfs)
# And plot
fig, ax = plt.subplots(figsize=(8, 4))
cbg_palette = ['#c6c6c666'] + cb_palette
full_sim_df['m_label'] = full_sim_df['m'].apply(lambda x: "Unmarried" if x == 0 else "Married")
full_sim_df = full_sim_df.rename(columns={'age': 'Age', 'h': 'Happiness'})
happiness_plot = sns.scatterplot(
x='Age', y='Happiness', hue='m_label',
data=full_sim_df,
palette=cbg_palette[:2],
s=24,
ax=ax,
legend=True,
);
# happiness_plot.move_legend("upper center", bbox_to_anchor=(0.5, 1.15), ncol=2);
sns.move_legend(ax, "upper center", bbox_to_anchor=(0.5, 1.15), ncol=2);
happiness_plot.legend_.set_title("");
happiness_plot.axvline(x=17.5, color='black', ls='dashed', lw=1);
plt.show();