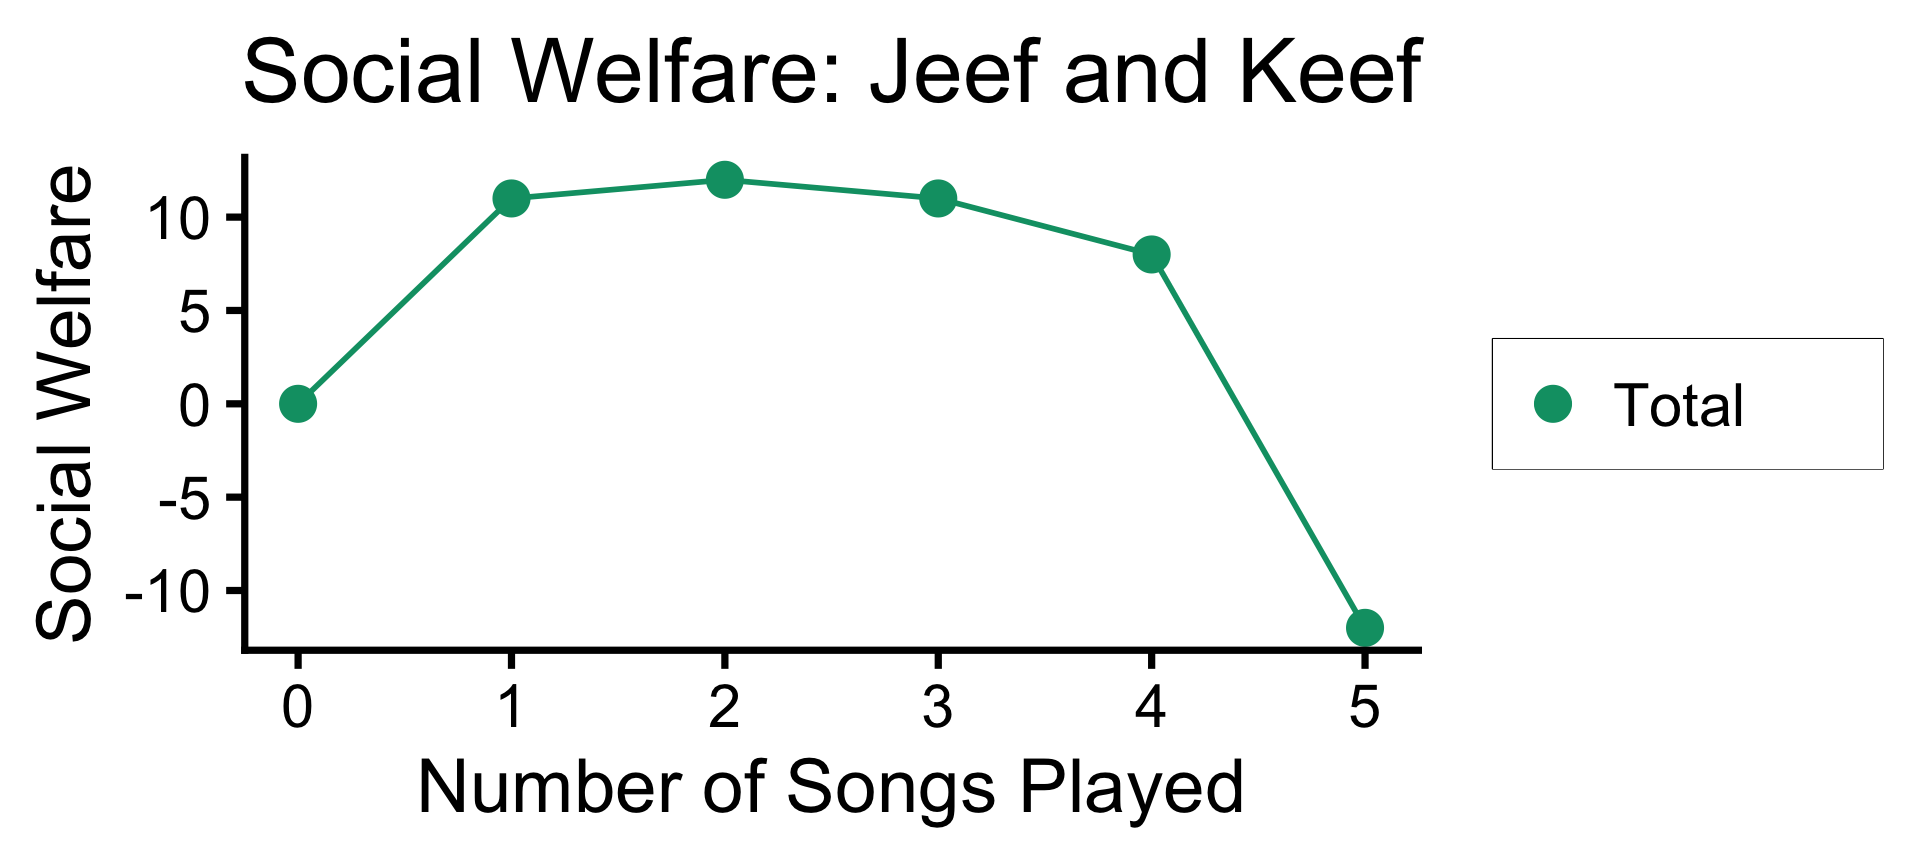
| Songs | Jeef | Keef | Total |
|---|---|---|---|
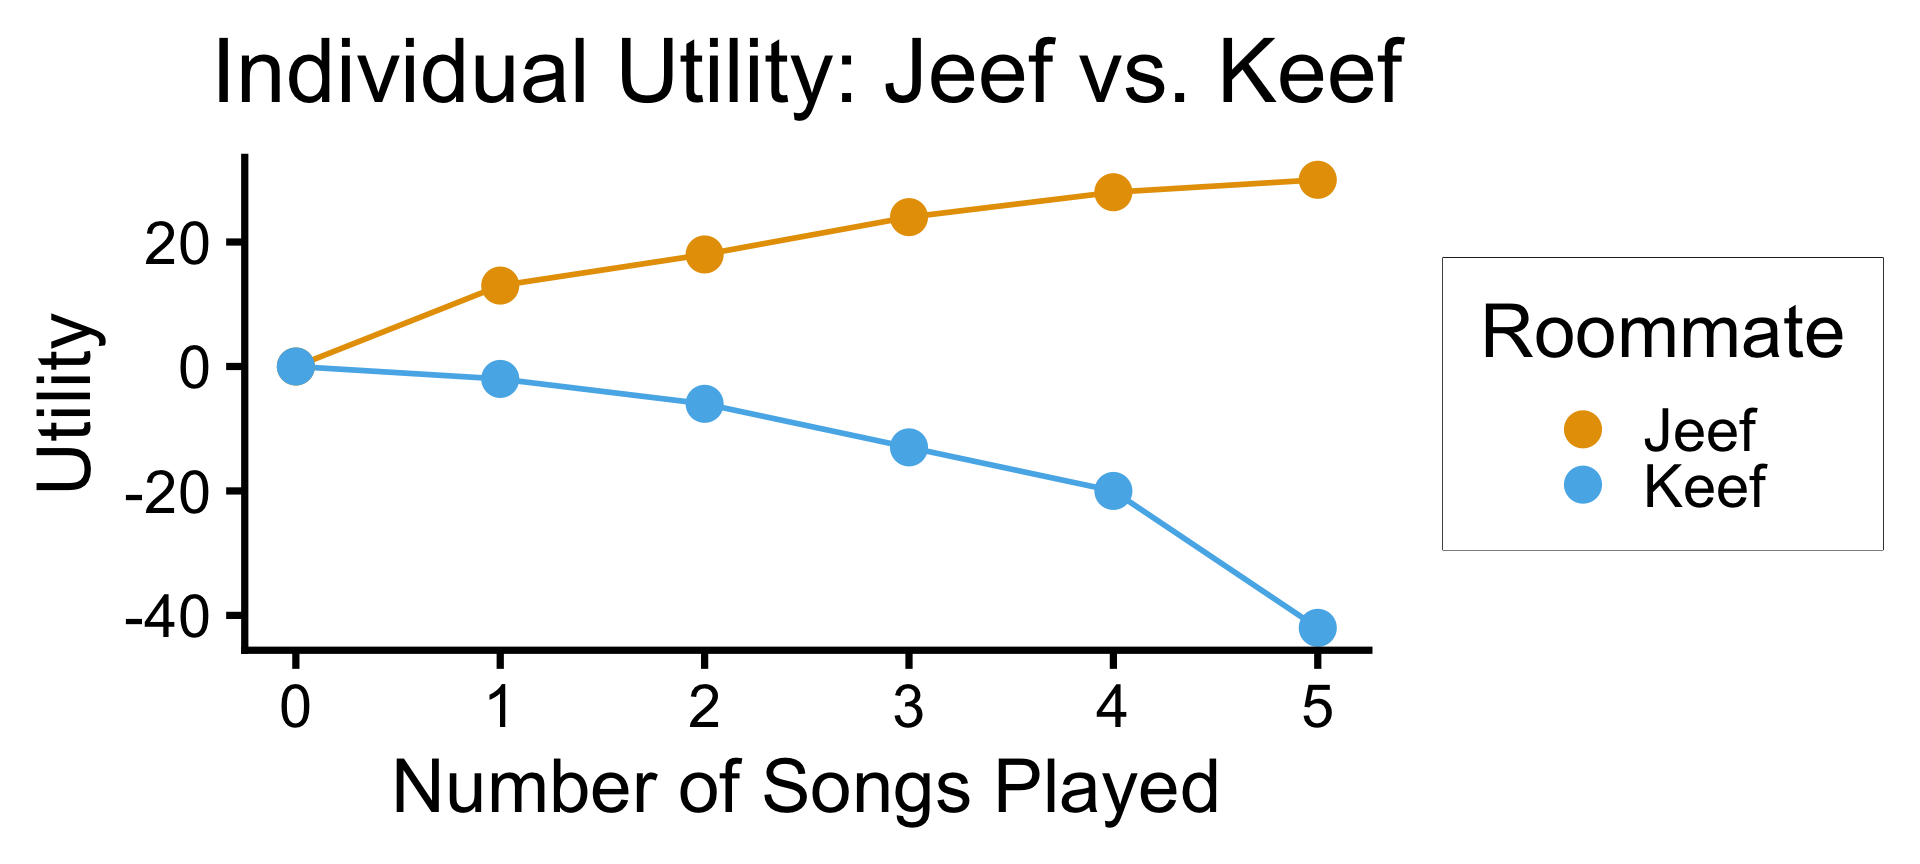
| 0 | 0 | 0 | 0 |
| 1 | 13 | -2 | 11 |
| 2 | 18 | -6 | 12 |
| 3 | 24 | -13 | 11 |
| 4 | 28 | -20 | 8 |
| 5 | 30 | -42 | -12 |
Week 13: SWFLs, Identity Formation, and Discourse Ethics
DSAN 5450: Data Ethics and Policy
Spring 2026, Georgetown University
Wednesday, April 15, 2026
Last Week: Social Welfare Functionals
(Fun notation:)
- SWF \(w(x)\) = Social Welfare Function:
- Plug in a Policy \(x\), obtain a Welfare “Level” \(y \in \mathbb{R}\)
- Policy \(x_1\) “better than” policy \(x_0\) iff \(w(x_1) > w(x_0)\)
- But how do we construct this function? Two antecedents:
- Methodological individualism: groups don’t have “preferences” as such; individuals do (if you ask a group for their opinion, how is answer generated? Discussion? Voting? Dictatorship?)
- Ideal speech situation: Habermas (1990) (later/next week)
- SWFL \(W(\mathbf{u})\) = Social Welfare Functional (Sen 1970): Explicit account of “social preference” as aggregation of individual preferences!
- Plug in Utility profile \((u_1(\cdot), \ldots, u_n(\cdot))\), obtain SWF \(w(x)\)
- \(W(\mathbf{u})(x)\) = Aggregate individual preferences via \(W(\mathbf{u})\) (producing a SWF), then evaluate this aggregation at \(x\)


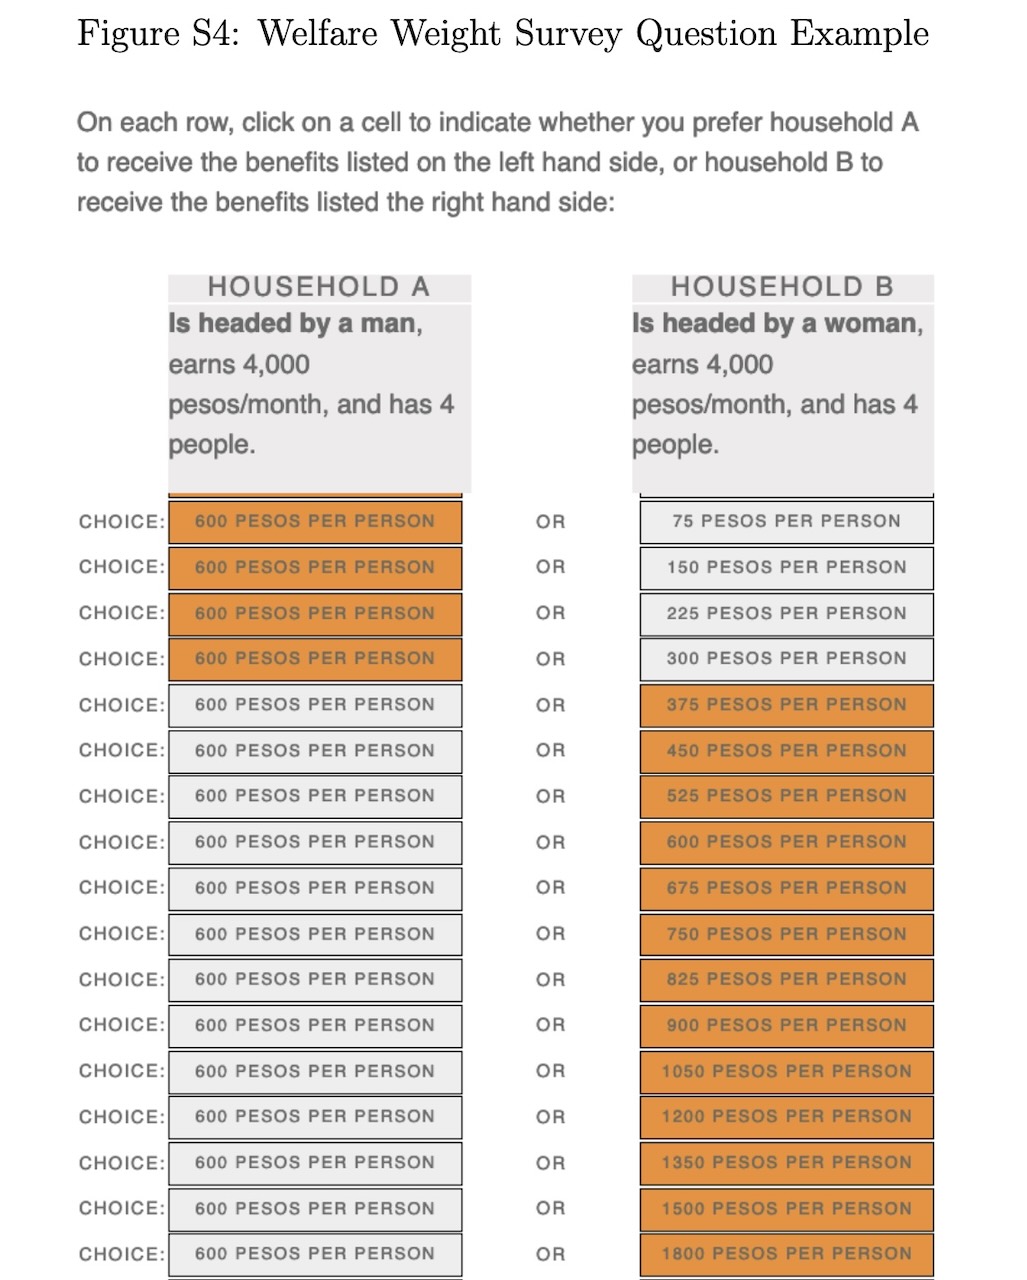
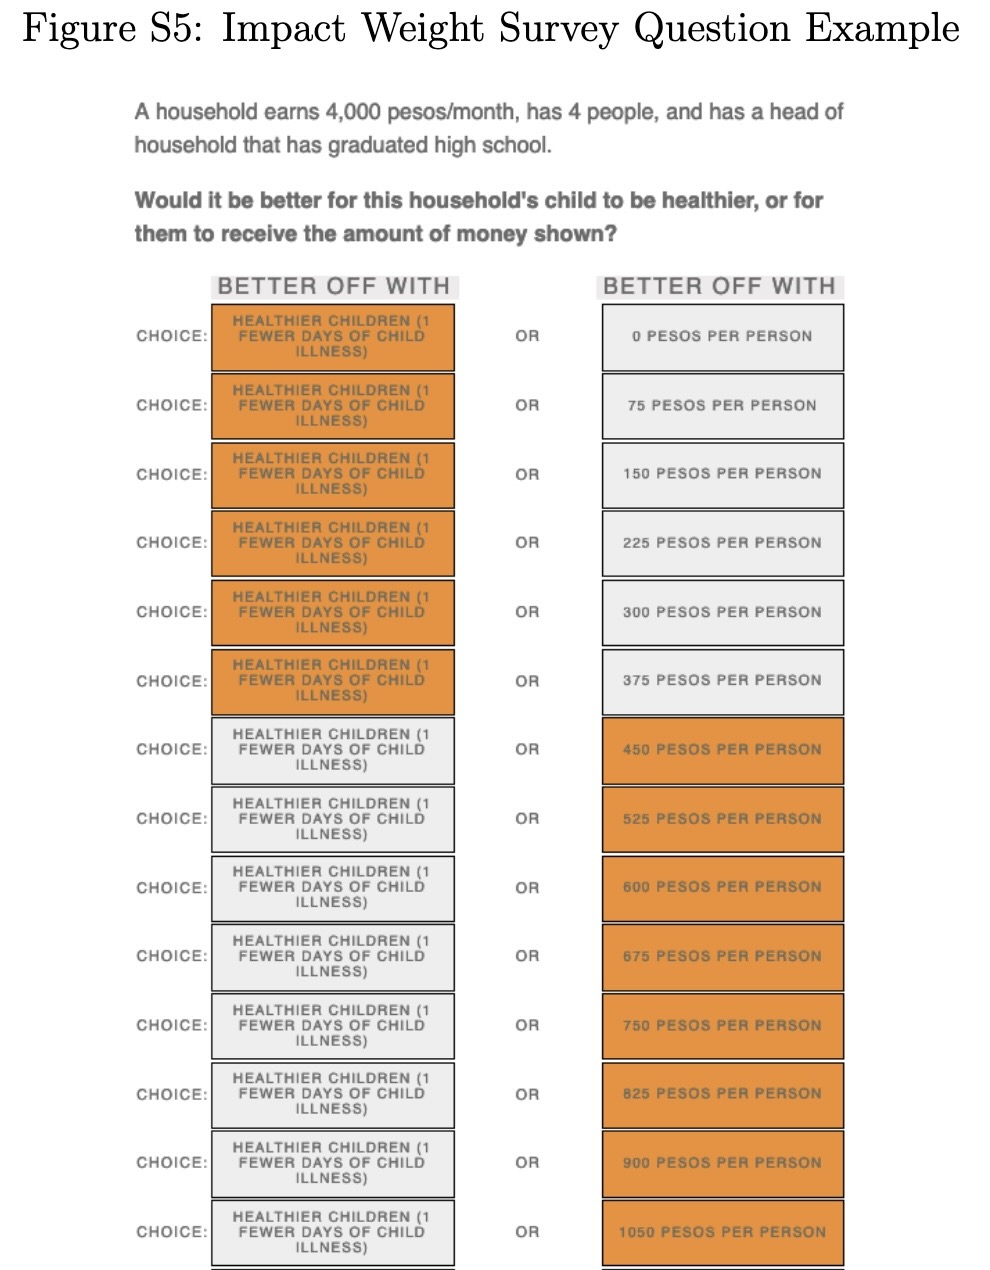
Inferring SWF from Surveys
“Conjoint Study”!
Remaining (But Most Challenging) Details
- Who gets included in the SWF?
- People in one household? One community? One state? One country?
- People in the future?
- Animals?
- …OUR BEAUTIFUL ENVIRONMENT???

Utility \(\rightarrow\) Social Welfare with Externalities
- Jeef and Keef are roommates: Jeef loves listening to Tony Danza Tapdance Extravaganza, but Keef is normal and slowly dies inside with each additional song
Data-Ethical Toolkit: Implementation 👀
Code
library(tidyverse) |> suppressPackageStartupMessages()
canada_df <- tibble::tribble(
  ~Ethnicity, ~Year, ~`Percent of Total`,
  "Canadian", 1991, 3.3,
  "Canadian", 1996, 30.9,
  "Canadian", 2001, 39.4,
  "Canadian", 2006, 32.2,
  "Canadian", 2011, 32.2,
  "Canadian", 2016, 32.3,
  "Canadian", 2021, 15.6,
  "British", 1991, 20.8,
  "British", 1996, 35.9,
  "British", 2001, 33.6,
  "British", 2006, 52.8,
  "British", 2011, 34.5,
  "British", 2016, 32.5,
  "British", 2021, 42.7,
  "French", 1991, 22.8,
  "French", 1996, 19.0,
  "French", 2001, 15.8,
  "French", 2006, 16.1,
  "French", 2011, 15.5,
  "French", 2016, 13.6,
  "French", 2021, 11.0,
  "Aboriginal", 1991, 1.7,
  "Aboriginal", 1996, 3.7,
  "Aboriginal", 2001, 4.5,
  "Aboriginal", 2006, 5.5,
  "Aboriginal", 2011, 5.6,
  "Aboriginal", 2016, 6.2,
  "Aboriginal", 2021, 4.9,
)
canada_df |> ggplot(aes(x=Year, y=`Percent of Total`, color=Ethnicity)) +
  geom_point() +
  geom_line() +
  theme_dsan(base_size=24) +
  ylim(0, 60) +
  labs(title="Canadian Census Responses, 1991-2021")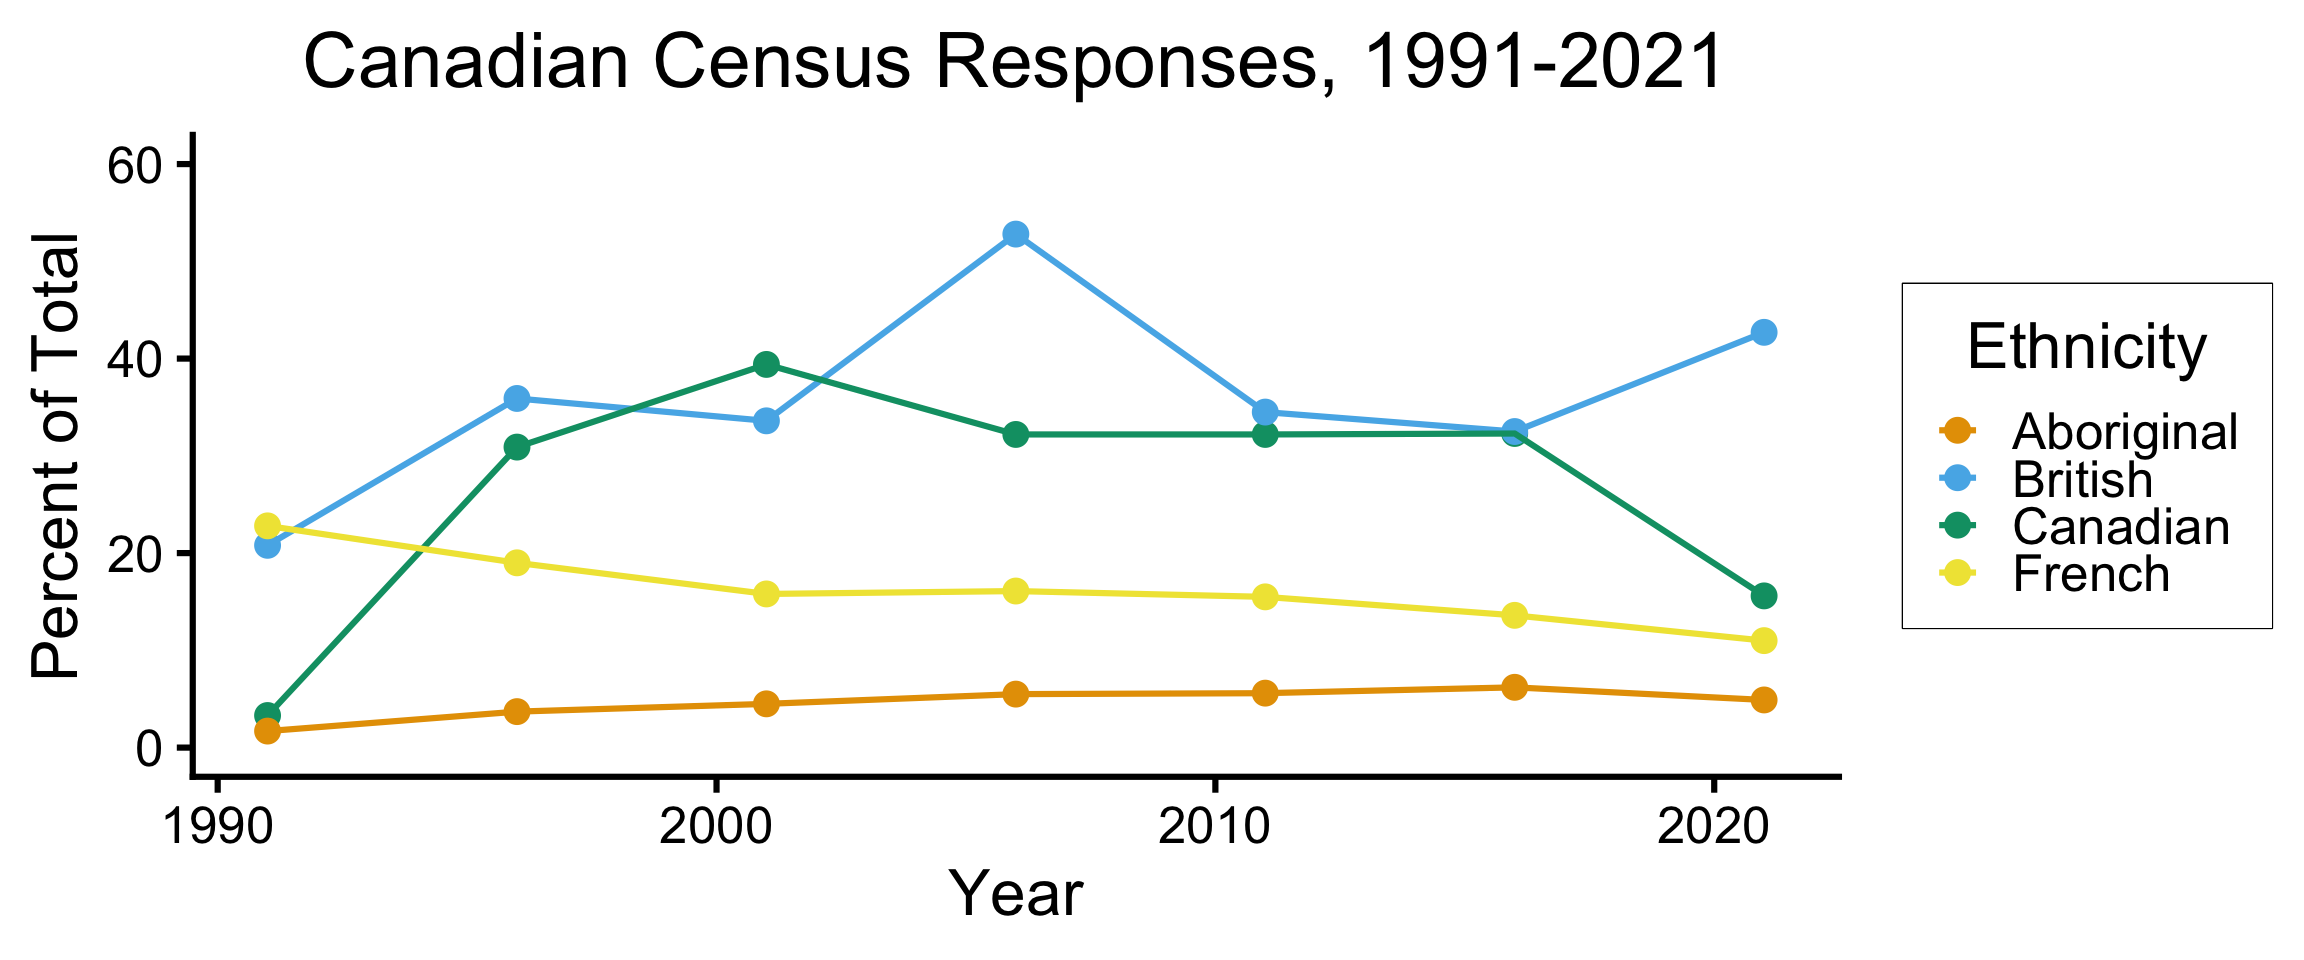
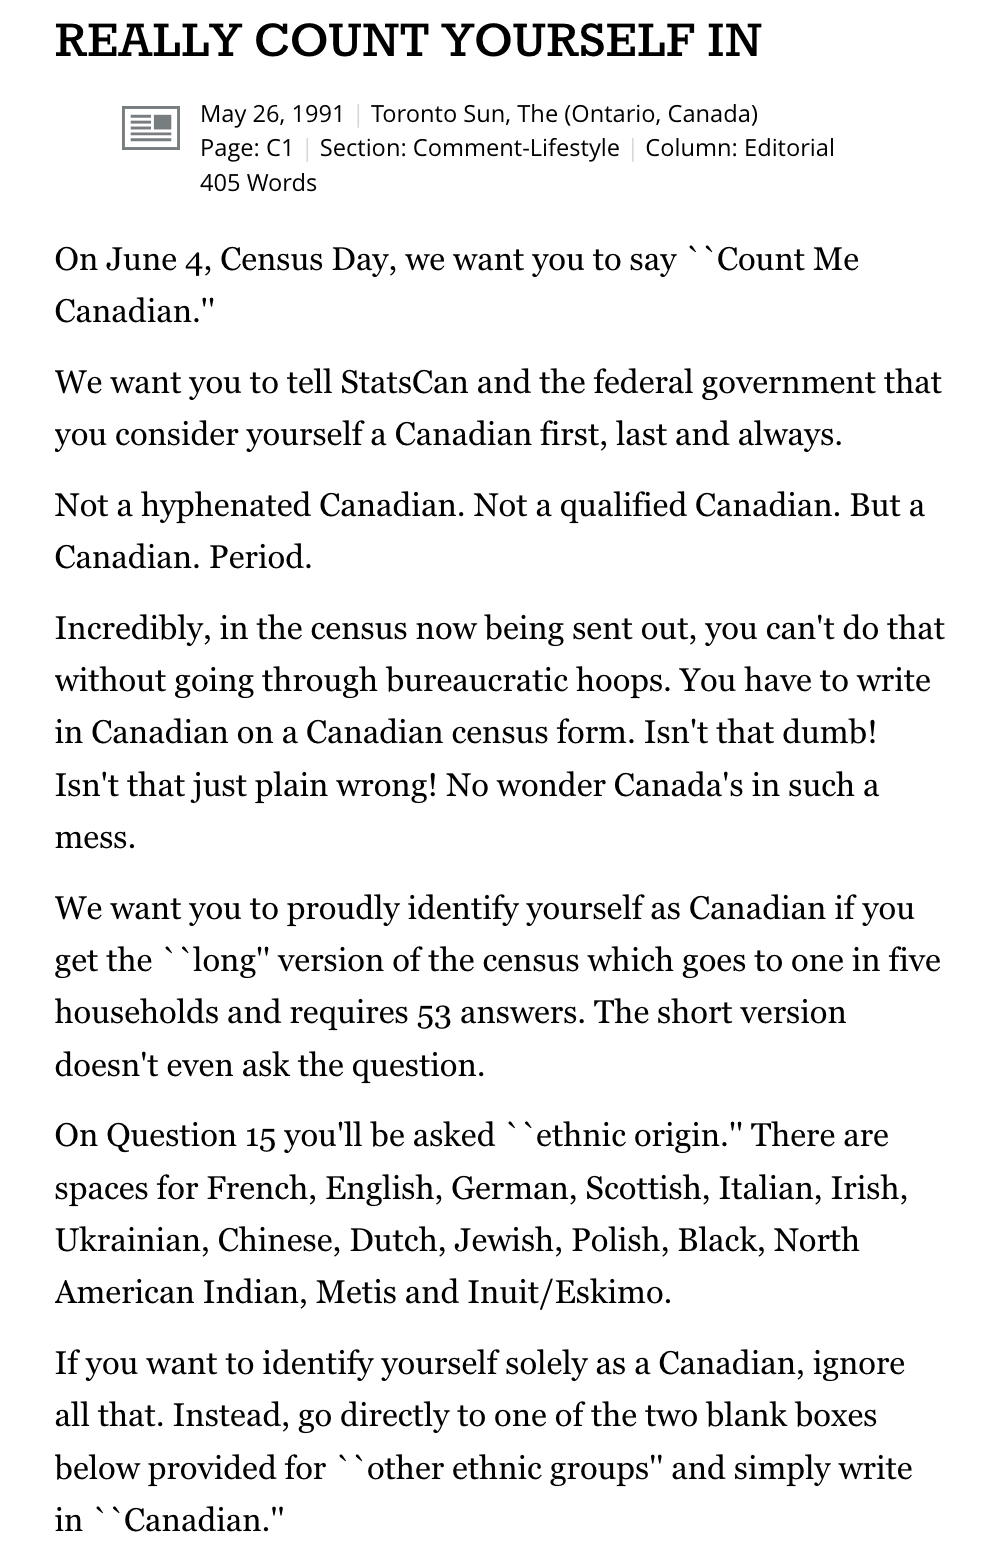
- 1991: “Count Me Canadian!” ad campaign in Toronto Sun \(\leadsto\) 3.3% write in “Canadian” \(\leadsto\) 5th largest “ethnicity” in Canada
- 1996: Legally, “Canadian” must be listed 5th in examples \(\leadsto\) 24.1% respond “Canadian” \(\leadsto\) 1st largest ethnicity
- 2001-2021: Legally, “Canadian” must be listed 1st in examples
- 2021: “French Canadian” added as option (previously recorded as two responses: “French”, “Canadian”)