Week 10: Evaluating and Interpreting Linear Regression, Machine Learning
DSUA111: Data Science for Everyone, NYU, Fall 2020
TA Jeff, jpj251@nyu.edu
- This slideshow: https://jjacobs.me/dsua111-sections/week-10
- All materials: https://github.com/jpowerj/dsua111-sections
Outline
I. Evaluating and Interpreting Linear Regression
- Coefficient Interpretation
- p-value Interpretation
- Evaluating Results
II. Machine Learning (aka Fancy Regressions)
- Statistics vs. Machine Learning?
- ML Approach to Regression
- Evaluating Machine Learning Models
Part I: Evaluating and Interpreting Linear Regression
Substantive vs. Significant Effects
- Substantive: Is it interesting for society?
- Significant: How much do we believe it?
- Example: A government carries out two studies:
- One finds that a means-tested welfare program decreases poverty by 0.00001%, significant at the 1% level of confidence.
- The other finds that a universal basic income program decreases poverty by 10%, significant at the 10% level of confidence (but not 5% or 1%)
- Which is more substantive? Which is more significant?
- October 16, 2020: "JFI, Mayor Aja Brown, and Fund for Guaranteed Income announce largest city-based guaranteed income initiative"
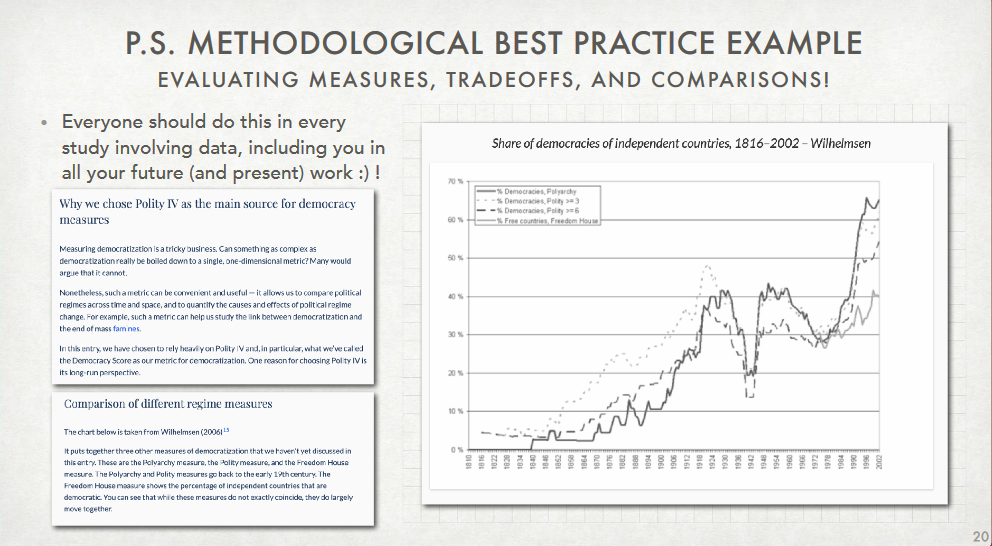
Justify Your Measures!
p-values
[In theory,] "the probability of getting the coefficient we got if the null hypothesis is correct"
- In regression analyses, null hypothesis is almost always "coefficient of interest is 0"
- Hence, in regression the p-value is "the probability we'd get the observed coefficient (the coefficient in the regression results table) if the true coefficient is 0"
- $\implies$ the smaller the p-value is, the more we "believe" that the effect we found is real
In practice, too many "moving parts" in experiments (and ESPECIALLY in observational studies) for this to be that meaningful
- Bayesian statistical approach used more and more since ~the 80s, since computers allow us to compute more subtle measures/incorporate more details and prior knowledge than the (frequentist) p-value
- e.g., if 1 million experiments up til now found the gravitational constant to be $6.67408 \times 10^{-11}$, but we do an experiment which results in an estimate of $3$, Bayesian approach allows us to view this result more skeptically given prior information/data
- Gelman, Andrew. "P Values and Statistical Practice". Epidemiology 24(1): 69-72. 2013
OLS Diagnostics
In this class we focus on:
- R-squared
- Adj. R-squared
- Prob(F-statistic)
- Confidence interval
R-Squared
- In theory, "The proportion of variance in the dependent variable 'explained by' the independent variable(s)"
- In practice, "explained by" is a loaded term, and honestly I would just think of it like a regression-specific correlation measure
- "Adjusted" R-Squared just applies a penalty for each additional variable you include in your model (since you can always make non-adjusted R-squared increase by adding more and more variables)
F-Statistic
- The p-value is specific to one coefficient, on one independent variable ("how significant is this coefficient/this independent variable's effect on the dependent variable")
- The F-statistic can be thought of like a p-value for your whole model, for all coefficients/independent variables. Similarly to the p-value, the F-statistic value is the probability of getting your model if all coefficients were 0.
Confidence Intervals
- "Confidence intervals tell us: If we conduct our study many, many times, 95% of the time our confidence interval will capture the true coefficient"
- "Important: Confidence intervals do not say that we are '95% confident our coefficient is within this range'"
- (Jeff's 2 cents: more trouble than they're worth... see Gelman article above)
Multiple Regression
- You can have more than one independent variable!
- $Y_i = \beta_0 + \beta_1x_{1,i} + \beta_2x_{2,i} + \ldots + \beta_Nx_{N,i}$
- $x_{1,i}$: 1st independent variable (its value for person $i$)
- $x_{2,i}$: 2nd independent variable (its value for person $i$)
- $\cdots$
- $x_{N,i}$: $N$th independent variable (its value for person $i$)
- Now, the coefficient interpretation changes a bit:
- An increase of 1 unit in $x_{1}$ is associated with an increase of $\beta_1$ units in $Y$, when all other variables are held constant
Part II: Machine Learning (aka Fancy Regressions)
Statistics vs. Machine Learning
Biggest difference has to do with the respective goals of the two approaches:
- Statistics: Inference (Why is something happening? What is the relationship between variables of interest? What causes economic growth?)
- Machine Learning: Prediction (What is going to happen next? Will people who do X also do Y? What will be the level of the stock market one month from today?
(from Lecture 18.1, Slide 4)
The Difference in Practice
- You've already seen "statistical" regression, where you toss all the data into
statsmodelsand observe the result - In Machine Learning, it's a bit more involved:
- Split the data into training and testing sets (typically 80% of the data for training, 20% for testing)
- Train the model on the training set
- Evaluate the model on the testing set
- Make predictions (but perhaps don't learn as much about the underlying relationships between variables)
- [Note: SUPER important that the ML algorithm never sees the test data]
(from Lecture 18.1, Slide 10)
scikit-learn
import sklearn- Load data
- Split into training (80%) and test (20%) sets
- Train the model
- (What's going on "under the hood" here? Actually not that scary and worth knowing!)
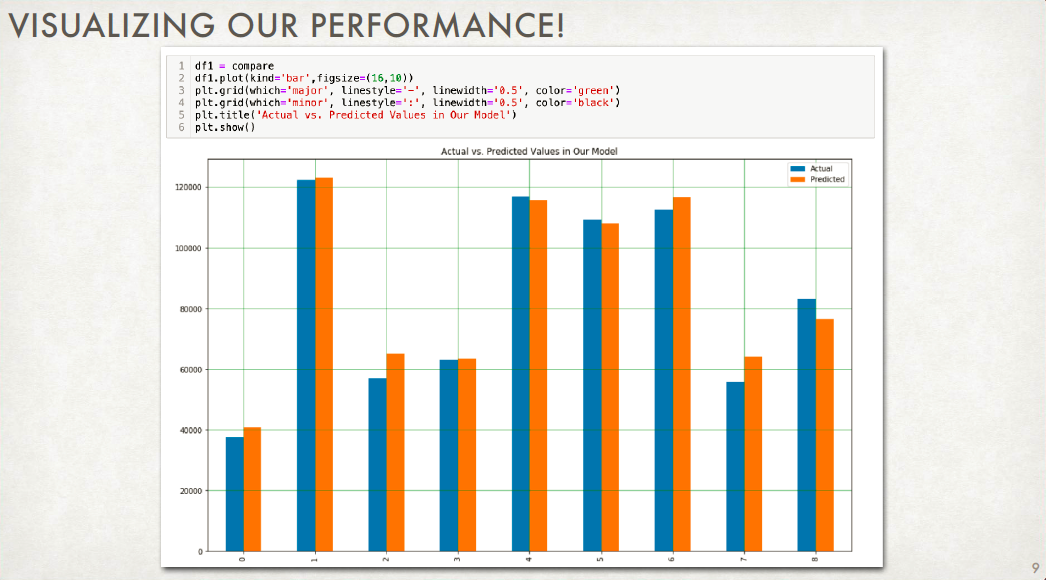
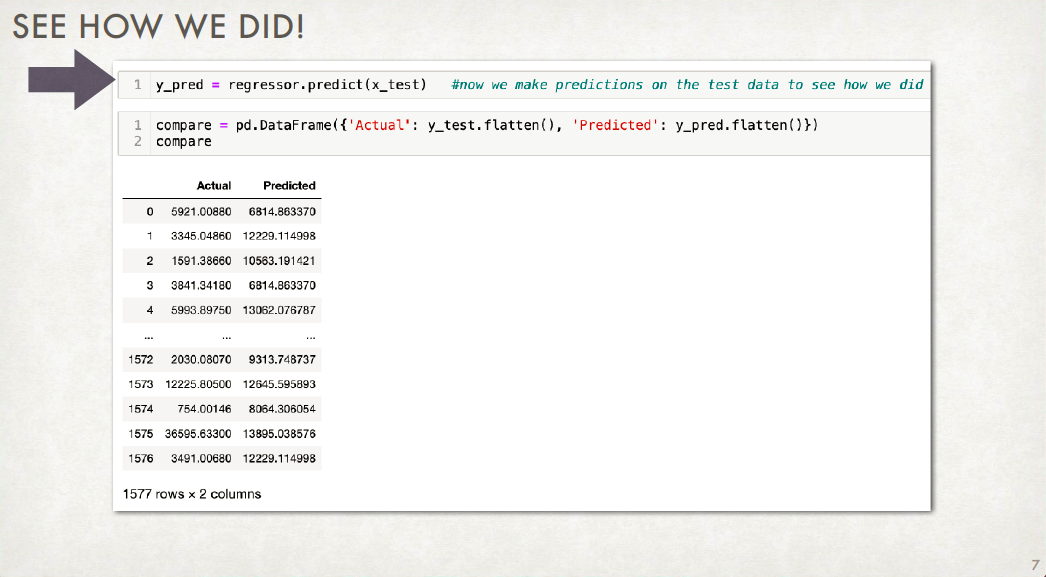
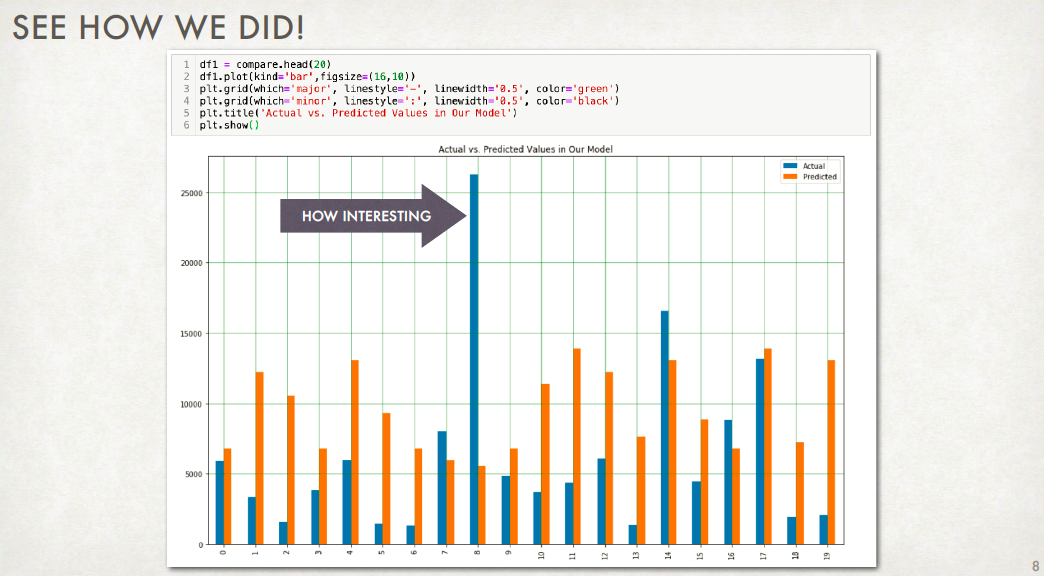
- Ask the model to predict dependent variable values given independent variable values in the test set
- Compute accuracy by comparing these predicted dependent variable values with the actual dependent variable values in the test set (important: the ML model never ever looks at these!)
OVERFITTING: Why you should NOT be maximizing accuracy
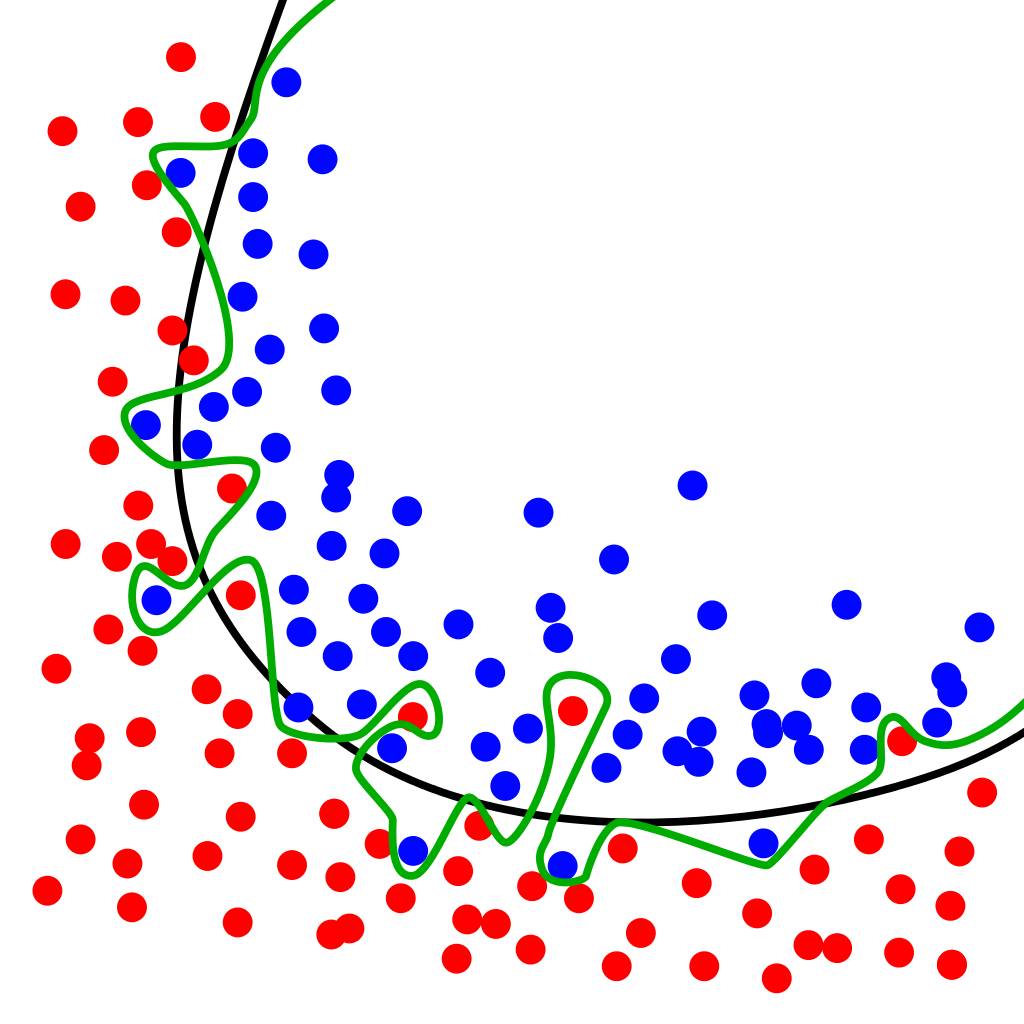
How to Know When You're Overfitting
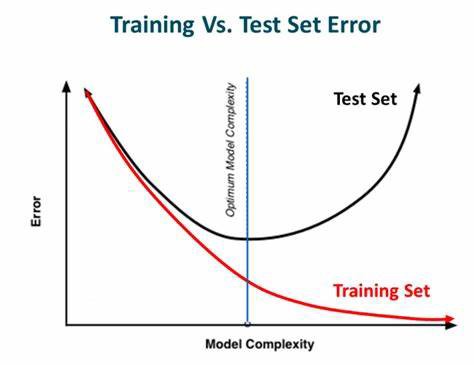
(from https://medium.com/ai%C2%B3-theory-practice-business/dropout-early-stopping-188a23beb2f9)