Week 4: Causality Wrap-Up, Python Sequences and Libraries
DSUA111: Data Science for Everyone, NYU, Fall 2020
TA Jeff, jpj251@nyu.edu
- This slideshow: https://jjacobs.me/dsua111-sections/week-04
- All materials: https://github.com/jpowerj/dsua111-sections
Outline
- HW1 Feedback
- Causality Wrap-Up
- Python Sequences
- Python Libraries
0. HW1 Feedback
1. Causality Wrap-Up
Where we left off:
Fundamental Problem of Causal Inference: Forget Everything And Run?

Face Everything And Rise
- Find good comparison cases: Treatment Group and Control Group
- "Statistical Matching"
- Don't worry about the details, but tldr is:
- Find the two most similar people, put one in Treatment Group, the other in Control Group, and compare their outcomes
- Bam. If we can measure and take into account all variables that may be related to our causal hypothesis, this is as close as we can possibly get to "solving" FPCI
- [Not on the midterm or final, but relevant in case you're despairing about FPCI]
Controlled Experiments: How/Why Do They Help?
- Random Assignment: Vietnam War/Second Indochina War Draft
- Key point: makes treatment and control groups similar, on average, without us having to do any work!
- (e.g., don't need to worry about "pairing up" similar treatment+control units via statistical matching)
- No more Selection Effects
- Omitted variables are in BOTH Treatment and Control groups
Complications: Selection
- Tldr: Why did this person (unit) end up in the treatment group? Why did this other person (unit) end up in the control group?
- Are there systematic differences?
- Vietnam/Indochina Draft: Why can't we just study [men who join the military] versus [men who don't], and take the difference as a causal estimate?
Complications: Compliance
- We ideally want people assigned to the treatment group to take the treatment, and people assigned to the control group to take the control.
- "Compliance" is the degree to which this is actually true in your experiment
- High compliance = most people actually took what they were assigned
- Low compliance = lots of people who were assigned to treatment actually took control, and vice-versa
- What problems might there be with compliance in the Draft example?
The Biggest Complication: Observational Data
- In observational studies, researchers have no control over assignment to treatment/control 😨
- On the one hand... Forget Everything And Run, if you can.
- On the other hand... statisticians over the last ~4 centuries have developed fancy causal inference tools/techniques to help us Face Everything And Rise!
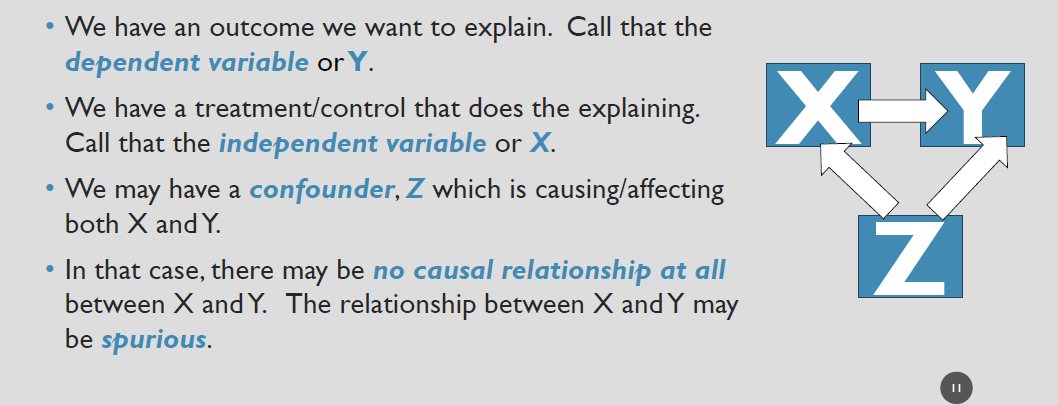
Causal Terminology for Observational Studies


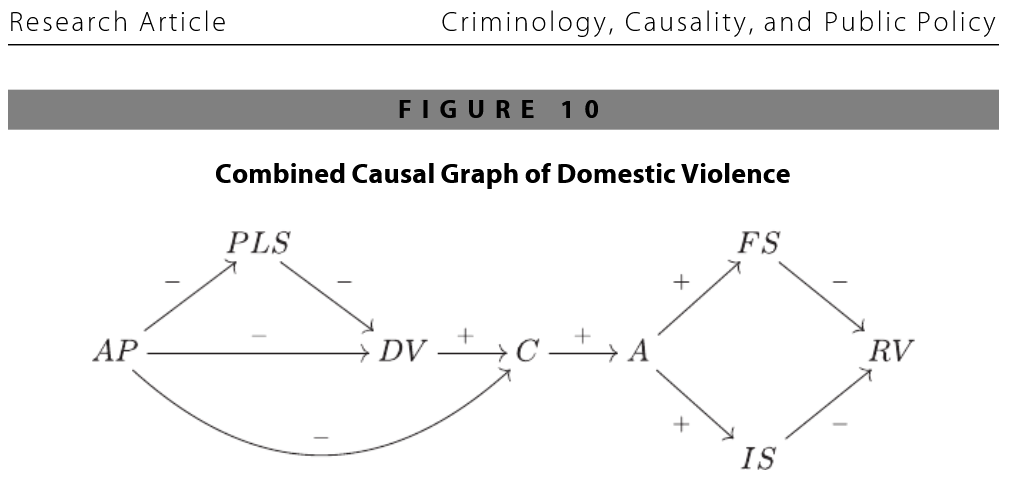
from Sampson, Winship, and Knight (2013), "Translating Causal Claims: Principles and Strategies for Policy‐Relevant Criminology"
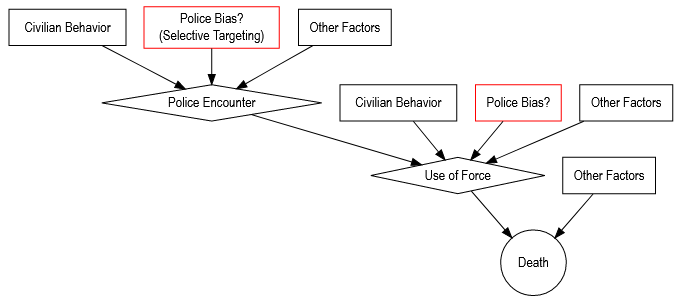
from Bradford (2020), "Observations on Police Shootings & Interracial Violence"
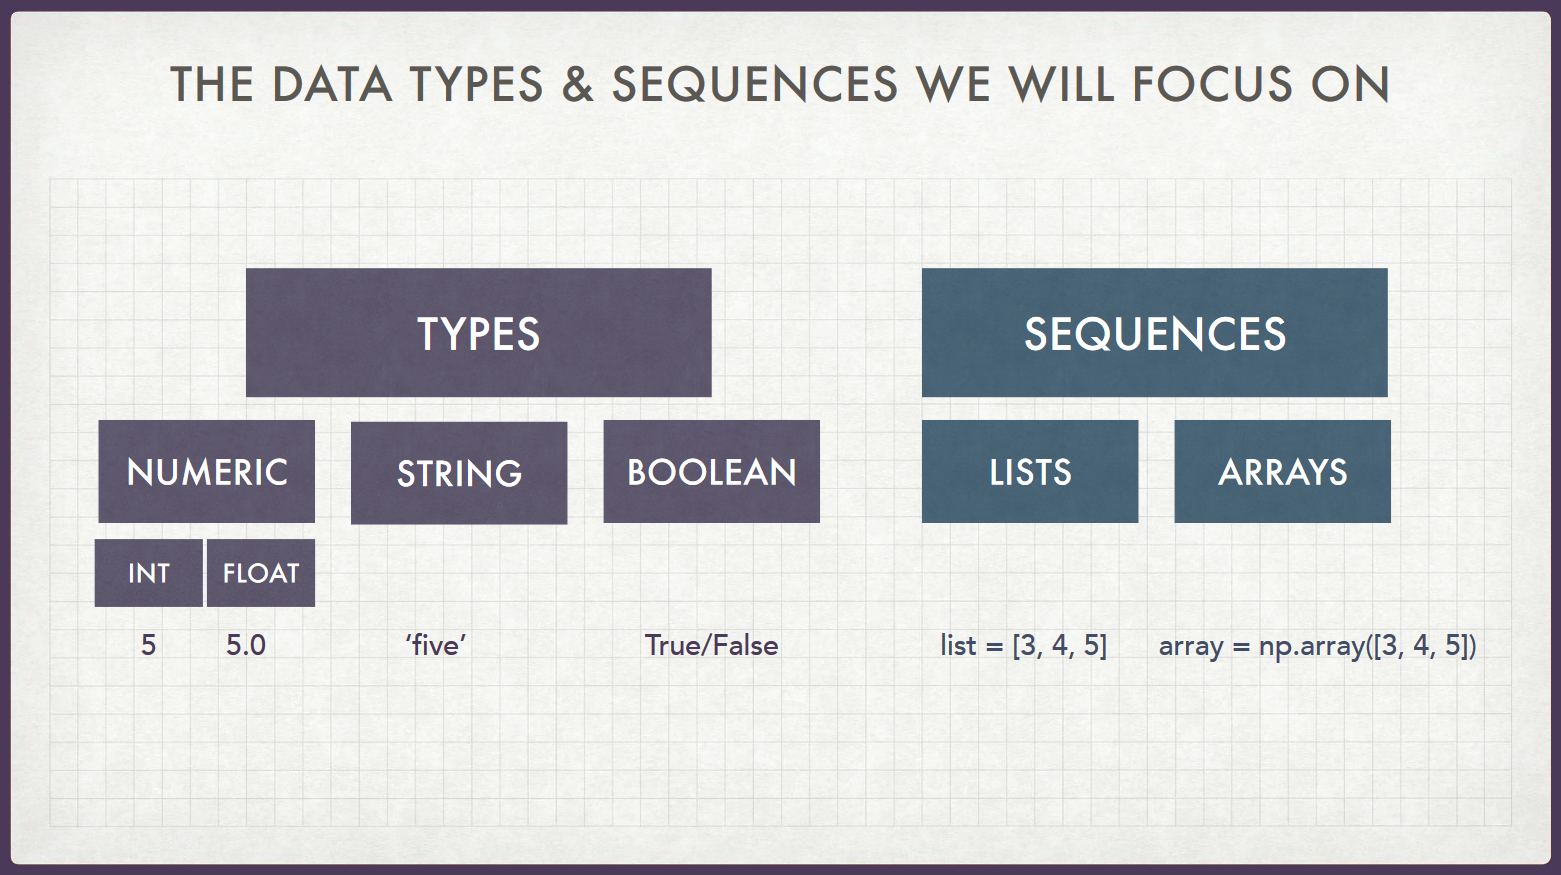
2. Python Sequences
Where we left off:
my_string = "Jeff"
my_float = 5.5
my_string * my_float
Jeff's TLDR
- Lists: Ordered sequences of... anything (including lists themselves 🤯)
my_basic_list = [1, "one", 1.0]
print(my_basic_list)
my_meta_list = [my_basic_list, 2, "two", 2.0, [3, "three", 3.0]]
print(my_meta_list)
- This is not the same as
my_non_meta_list = my_basic_list + [2, "two", 2.0] + [3, "three", 3.0]
print(my_non_meta_list)
- ^(!!!)
Ordered?
- We specify "ordered" only because there are also
sets, which contain elements but have no notion of a "first", "second", "third" element
ordered_list = [4, 3, 2, 1]
set(ordered_list)
Arrays are just fancier lists (for doing fancier math)
ordered_array = np.array(ordered_list)
- What happened?
Remember to import NumPy first!
import numpy as np
ordered_array = np.array(ordered_list)
print(ordered_array)
print(ordered_list)
ordered_list.mean()
ordered_array.mean()
Important difference, though: NumPy arrays require that all elements be the same type!
...so what happens if they're different?
no_bueno = np.array([1,"two",3.0])
no_bueno
print(type(no_bueno[0]))
print(type(no_bueno[1]))
print(type(no_bueno[2]))
Bracket Madness
[](square brackets):list{}(curly brackets):set(ordict)()(parentheses):tuple
type([1, 2, 3])
type({1, 2, 3})
type({1: "one", 2: "two", 3: "three"})
type((1, 2, 3))
3. Python Libraries
(From most basic to most fancy)
1. NumPy: import numpy as np
$\rightarrow$ Math with arrays
2. Pandas: import pandas as pd
$\rightarrow$ Math with Tables (DataFrames)
3. Matplotlib: import matplotlib.pyplot as plt
$\rightarrow$ Visualizing NumPy/Pandas objects
4. Statsmodels: import statsmodels.formula.api as smf
$\rightarrow$ Statistical hypothesis testing
5. Seaborn: import seaborn as sns
$\rightarrow$ Visualizing statistical hypothesis tests
6. Scikit-learn: import sklearn
$\rightarrow$ Fancy machine learning things
NumPy
import numpy as np
cool_array = np.array([1, 2, 3, 4, 5])
cool_array.std()
Pandas
import pandas as pd
cool_df = pd.DataFrame(
    {'x':[1,2,3,4,5,6,7,8],
     'y':[2,4,5,5,7,9,10,13],
     'z':[0,0,1,0,1,1,1,1]}
)
cool_df.head()
Matplotlib
import matplotlib.pyplot as plt
plt.scatter(cool_df['x'], cool_df['y'])
plt.show()

Statsmodels
import statsmodels.formula.api as smf
result = smf.ols('y ~ x', data=cool_df).fit()
print(result.summary().tables[1])
Seaborn
import seaborn as sns
sns.regplot(x='x', y='y', data=cool_df);

Scikit-learn
import sklearn
import scikitplot as skplt
skplt.metrics.plot_confusion_matrix(classes, predictions, normalize=True)
plt.show()
